Domestic demand: The Cinderella of crop demand
By Dr. Daryll E. Ray , University of Tennessee
In recent columns we have emphasized the message that exports, be they to China
or elsewhere in the world are not likely to be the long-term salvation of the
U.S. crop sector. It is not an exaggeration to say that, counter to conventional
wisdom, exports HAVE NOT been the engine that has been the driving force behind
U.S. crop agriculture for the last 25 years.
If it is not exports, then what has been the phenomenon that has helped absorb
the great yield increases of the last 25 years? An examination of the data shows
that the driving force in absorbing agriculture’s increased productivity has
been the lowly Cinderella, domestic demand, who has been busy sweeping the
hearth and tending to mundane household chores while her sister, exports, has
garnered the attention of analysts, legislators, and academics.
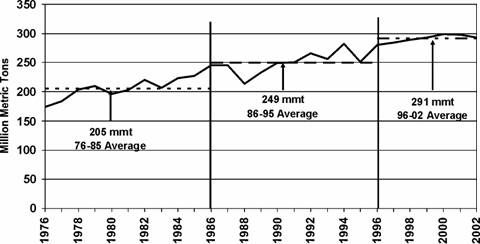
Figure 1 shows the trend in domestic demand for the eight major crops grown by
U.S. producers. During the ten years before the implementation of the 1985 Farm
Bill domestic demand averaged 205 million metric tons (mmt) a year. During the
next ten years the average rose to 249 mmt. In the years since the adoption of
the 1996 Farm Bill, domestic demand has continued to increase averaging 291 mmt
for the 1996-2002 period.
Figure 1. U.S. domestic demand for eight major crops (corn, soybeans, wheat, grain sorghum, rice, cotton, oats, and barley), 1976-2002. Data source: USDA.
We are often told that domestic demand has little significant upward
potential because its growth is limited to the population growth rate. Looking
at the change over the 27 year period, we can see that domestic demand has grown
from 173.8 (mmt) in 1976 to 293.2 mmt in 2002. This represents a 68.7 percent
increase in domestic demand during a period in which the U.S. population grew by
27.5 percent.
It would seem that something must be wrong with this data until we look a little
further. The first place to look is at changes in the American diet. According
to U.N. Food and Agricultural Organization (FAO) food balance sheets the average
daily caloric consumption of Americans has risen from 3,147 to 3,772. This is a
20 percent increase over the 27 years.
The average yearly per capita wheat consumption increased from 156 lbs. in 1976
to 188 lbs in 2000; rice, from 6 lbs. to 21 lbs; corn from 15 lbs. to 30 lbs.;
and oats from 1 lb. to 7 lbs. The average yearly per capita beef consumption has
dropped from 128 lbs. in 1976 to 97 lbs. in 2000 while pork has risen from 56
lbs. to 65 lbs. The big gainer among meats, however, is poultry increasing from
50 lbs. per capita per year to 105 lbs. in 2000.
Together, population growth and the increase in per capita caloric consumption
raised gross caloric consumption by 53%. While some of this growth comes from
food products other than the 8 major crops, it seems clear that the expanding
waistline of the average American has been a part of the increase in domestic
demand for the 8 major crops. Further study would undoubtedly reveal that
domestic industrial and energy use of crops have been important drivers of
increased crop demand.
While I am sure that there is an upper limit to per capita caloric consumption,
the experience of the last 27 years reminds us that we need to pay attention to
domestic demand as a source of growth for U.S. crop markets. If we took some of
the money spent trying to make the U.S. more competitive in world markets and
added it to investments in research to expand energy and industrial uses for our
crops, the payoff could be substantial. And Cinderella would get the attention
she so rightly deserves.
Reproduction Permission Granted with:
1) Full attribution to Daryll E. Ray and the Agricultural Policy Analysis
Center, University of Tennessee, Knoxville, TN;
2) An email sent to hdschaffer@utk.edu indicating how often you intend on
running Dr. Ray’s column and your total circulation. Also, please send one copy
of the first issue with Dr. Ray’s column in it to Harwood Schaffer, Agricultural
Policy Analysis Center, 310 Morgan Hall, Knoxville, TN 37996-4500.